top of page

Investment Reports
Our portfolio and fund performance analysis reports are tailored to suit your requirements whether that be in-house monitoring, board reports or end clients. We are experts at benchmarking returns and providing analysis against risk - making risk concepts easy to understand and to communicate - all to ensure that you act on time for the benefit of your clients.
FGC can provide on-going monitoring, one off heath checks and reviews and help to improve your existing reporting.
The following charts provide select examples of value to be added from working with FGC. Click through to see more examples.
 • Effective dashboards and fund reports <br> are created by careful selection of reports <br> to meet client requirements. |  • Much financial analysis assumes so-called ‘normally <br> distributed’ (or Gaussian) returns, in practice <br> fund and benchmark return distributions often <br> differ significantly from this leading to unrealistic <br> assumptions and unexpected ‘black swan’ events. <br> • By examining the returns to see how they differ <br> from a Gaussian distribution the assessment <br> of past risks is more realistic, and more appropriate <br> historical performance measures can be adopted. |  • When comparing historical returns with a <br> selected benchmark or cash returns, it is useful to be <br> able to visualise not only the average returns over <br> some period, but also the degree of spread.<br> • Such approaches give an instant overview of <br> both average return and variability over the period <br> of interest. |
|---|---|---|
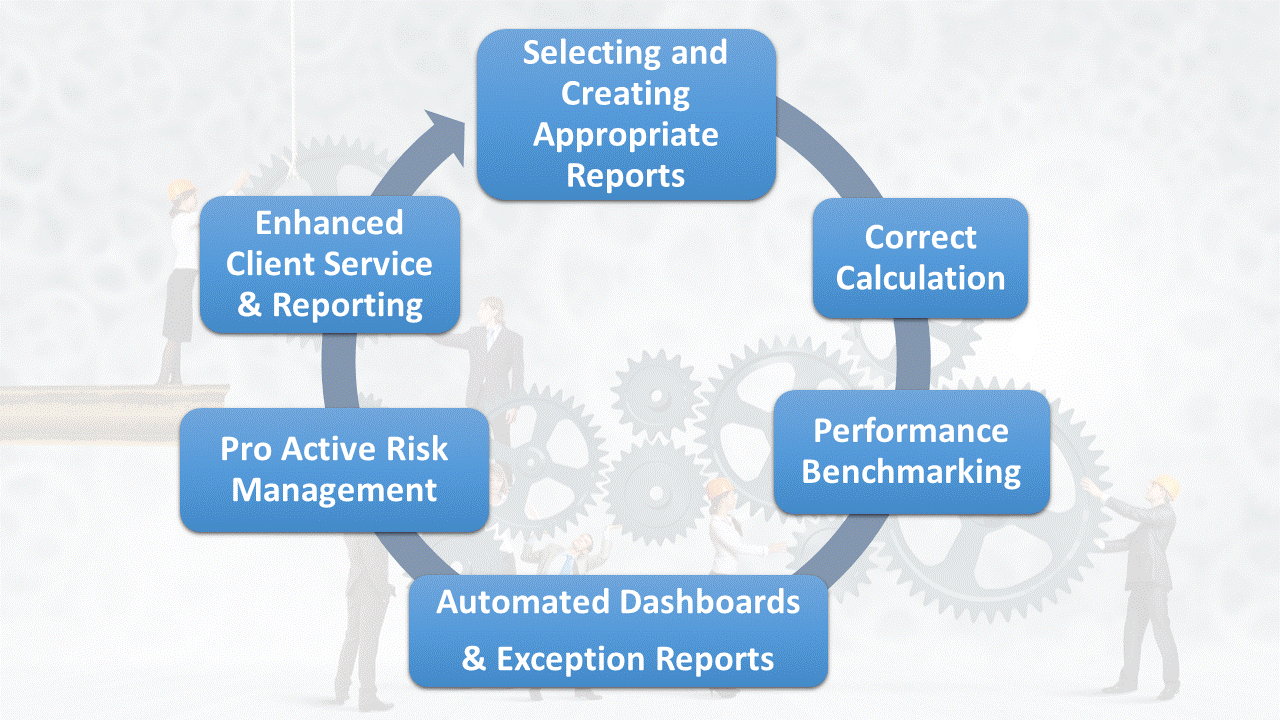
 • Correlations between assets and the selected <br> benchmarks give a useful initial guide to assessing <br> potential diversification within a portfolio or similarity to <br> a benchmark. |  • Rather than relying solely on commonly used <br> measures of risk such as volatility, which have known<br> flaws, historical risk can also be assessed in<br> terms of losses made using drawdown and other <br> related measures. |  • Investment monitoring is an active and ongoing <br> process<br> • Key to success is correct calculation, <br> selection of appropriate reports, benchmarks, and <br> a review process that highlights and draws attention <br> to outliers in order that matters requiring attention are <br> actively acted upon |
 • Overview of fund (or portfolio) performance<br> over the period of interest.<br> • Comparison with a benchmark index (BM) <br> and risk-free cash returns.<br> • Typically using total returns to capture <br> reinvested income in addition to capital growth. |  • Regression techniques can be used to deduce <br> the ‘behaves-like’ characteristics of a fund or <br> portfolio based on readily available historical <br> returns. <br> • These permit an evolving picture over time<br> of fund characteristics which can be used to test <br> or challenge manager assertions. |  • Collections of funds or portfolios can be <br> analysed to compare historical performance <br> over a period of interest.<br> • Here, the plot reveals both average returns and <br> their spread, adding a sense of return variability to<br> the comparison. <br> • The shapes outline the historical return <br> distributions, providing additional information <br> on the funds’ historical returns. |
 • The risk and return characteristics of a group<br> of funds or portfolios can be visualised with a risk-return<br> chart. <br> • The return-per-unit-risk characteristics <br> of the funds can be compared with a selected index <br> and risk-free cash rate. <br> • Dashed lines indicate average returns <br> for the benchmark and the fund group, as well as <br> the average volatility for the benchmark and the <br> fund group. |  • A Markowitz optimised efficient frontier gives <br> a sense of the theoretically possible range of <br> outcomes (solid blue and dashed lines), although <br> practical portfolio constraints may restrict <br> actual outcomes. In this example the opportunity <br> set encompassed by the Markowitz frontier is <br> enlarged by the inclusion of the benchmark <br> as an asset (solid blue line), potentially of interest if <br> an asset that tracks the benchmark index is<br> available. |
 |  |  |
|---|---|---|
 |  |  |
 |  |  |
bottom of page